There are no items in your cart
Add More
Add More
| Item Details | Price | ||
|---|---|---|---|


A product manager takes care of the product from its ideation till the release of the product. But, this journey does not stop here. As a Product Manager, it is also essential to understand how the product is performing in the market. But how does one do that?
The following are three categories of product success measures. First, metrics for forecasting revenue and building a business case; second, analytics for tracking your product once it's released; and third, metrics for analyzing customer satisfaction.
1. Metrics for Predicting Product Revenue
These figures aid in the development of a product's business case.
a. Monthly Recurring Revenue (MRR)
The predicted total revenue generated in a month is called monthly recurring revenue. Because a SaaS company's income and expenses fluctuate from month to month, MRR is very useful. It is calculated as follows:
monthly subscription rate * number of subscribers = MRR.
Divide the yearly sum by twelve to get the monthly membership rate if customers pay annually.
b. Average Revenue Per-user (ARPU)
Average revenue indicates how much revenue will be generated monthly or annually. ARPU is calculated as follows:
ARPU = monthly recurring revenue (MRR) / total accounts.
ARPU is helpful when considering profitability, price increases, and promotional discounts. It's also a metric for comparing your business to competitors.
c. Customer Life Time Value (CLTV)
The predictable revenue you can make during someone's term as a paying client is calculated by CLTV, which is commonly abbreviated as LTV. This measure provides a broader perspective than ARPU. CLTV is calculated as follows:
Average revenue per user (ARPU) x average customer lifetime = CLTV
Knowing how much money a typical client brings lets you figure out how much money you can spend on new customers while remaining profitable.
d. Customer Acquisition Cost (CAC)
This product management metric shows how much it costs to acquire a new customer. This covers marketing, sales, and advertising expenses, as well as the salary provided to your marketing and sales personnel. CAC can be calculated as follows:
Sales and marketing costs for a specific period (month, year, etc.) / total number of customers acquired during that same period = CAC
Knowing the cost of acquiring customers helps you decide when to raise prices or execute a new marketing plan for your product.
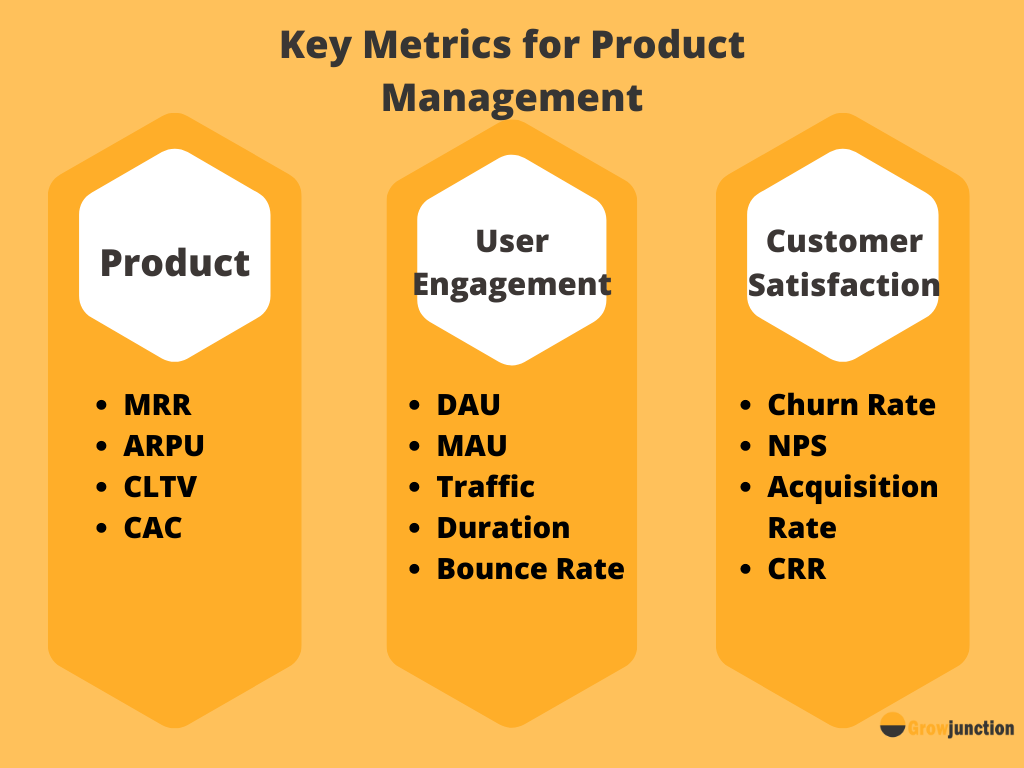
2. Metrics For Tracking User Engagement And Behavior
While stakeholders are interested in financial data, CEOs and product managers must go beyond the numbers. They require information on the performance of a product or feature. They're looking for analytics to help them assess and improve user engagement. If they don't employ these criteria, their revenue forecasts will eventually trend in the same direction: down.
a. Percentage of Users Who Are Active (DAU, MAU)
While recruiting customers is critical, the number of clients is not a key performance indicator. Knowing how many customers are actively utilizing their product is more beneficial for many firms. As a result, metrics like daily active users (DAU) and monthly active users (MAU) are frequently more relevant to track. Once you have these averages, you can determine your DAU/MAU ratio by using the following formula:
Number of daily active users / monthly active users = DAU/MAU ratio
This ratio can be tracked monthly to see if a product is increasing or starting to drop. As a result, this KPI is often utilized for mobile apps, social networking sites, and online gaming. It also aids in forecasting, budgeting, and making product development decisions.
b. Traffic (Organic/Paid)
Not every company prioritizes its regular customers. Some businesses, such as e-commerce websites, prefer a traffic-based KPI.
The number of clients who have found your website is determined by traffic stats. This indicator should also disclose if those clients were organic (i.e., found your website through a search) or paid (i.e., came from a paid source).
You can use traffic analytics to assess your distribution channels. This can assist you in determining which marketing methods have been the most successful, allowing you to focus your resources on those that generate the most money.
c. Duration of the session
A product analysis tool can give this metric, which analyses digital product usage over time, similar to traffic and DAU. It is calculated as follows:
Average session duration = total time spent by users/ number of users.
Remember that this isn't a perfect metric because it doesn't account for when a client is signed in but inactive.
d. Bounce Rate
The bounce rate is a measurement of how many people left your website or app after just seeing one page. This is crucial since you want to know if your site is entertaining or beneficial to others. This indicator is also provided by a product analysis tool, similar to traffic.
While knowing what percentage of visitors are leaving so rapidly can be valuable, the bounce rate will not tell you why. Whether your messaging was off or your site was tough to navigate, the bounce rate will not provide you with information to help you figure out what caused the problem
3. Customer Retention And Satisfaction Metrics
There are other indicators of product performance to consider because success must be judged differently for different digital products.
a. Churn Rate
The churn rate is a product management indicator that shows how long customers stay with you. The churn rate is the percentage of consumers who cease using your product or cancel their membership during a given period. You may figure out your churn rate by doing the following:
The number of churned customers (those lost) during a specified period / the number of existing customers
This figure can reveal information about client happiness as well as future profitability.
b. Net Promoter Score (NPS)
The net promoter score (NPS) is a metric that assesses consumer satisfaction with a product, service, or feature. The percentage of consumers promoting your products vs. the rate of customers detracting from your product is used to calculate this customer success statistic.
NPS is calculated as follows:
Percentage of promoters – the percentage of detractors = NPS
Create an NPS survey to identify whether a consumer is a promoter or a detractor. Customers are asked to rate your product or feature in this survey. A promoter is someone who gives you a nine or ten on a scale of one to ten. A detractor is a customer who gives you a score of zero to six. Passive or neutral people score in the seven or eight range.
c. Rate of Acquisition
This product success statistic indicates how frequently visits are converted into customers. To figure out your acquisition rate, do the following:
Number of new users / specific period = AR
d. Client Retention Rate (CRR)
Your client retention rate indicates how well your product keeps customers engaged over time. Your ability to keep consumers gives you insight into how successful you've established yourself in a particular market.
To figure out your client retention rate, do the following:
Number of existing customers at the end of a period/number of total customers at the start of that period = CRR
Because maintaining a customer is much less expensive than obtaining a new one, retention rates can directly link with revenue.
In my conversation with Mr. Moon TIga, Senior Product Manager at Yes Bank, he told me about the key metrics he has found to be most important during his professional journey so far. He tells me, " According to me, the top 3 metrics for product management would be a) Net Promoter Score b) Customer Acquisition Cost and Customer Retention Cost c) Monthly Recurring Revenue/ Annual Recurring Revenue."
Want to know how to get into Product Manager Role? Visit our course here.
Want to know the tools Product Managers use on a daily basis? Head on to our next blog Tools in Product Management .

Pragati Gupta
MBA Student, IIM Vizag
Interests: Content Creation, Traveling, Music
 Launch your Graphy